This is the Windows app named fgprof whose latest release can be downloaded as v0.9.3.zip. It can be run online in the free hosting provider OnWorks for workstations.
Download and run online this app named fgprof with OnWorks for free.
Follow these instructions in order to run this app:
- 1. Downloaded this application in your PC.
- 2. Enter in our file manager https://www.onworks.net/myfiles.php?username=XXXXX with the username that you want.
- 3. Upload this application in such filemanager.
- 4. Start any OS OnWorks online emulator from this website, but better Windows online emulator.
- 5. From the OnWorks Windows OS you have just started, goto our file manager https://www.onworks.net/myfiles.php?username=XXXXX with the username that you want.
- 6. Download the application and install it.
- 7. Download Wine from your Linux distributions software repositories. Once installed, you can then double-click the app to run them with Wine. You can also try PlayOnLinux, a fancy interface over Wine that will help you install popular Windows programs and games.
Wine is a way to run Windows software on Linux, but with no Windows required. Wine is an open-source Windows compatibility layer that can run Windows programs directly on any Linux desktop. Essentially, Wine is trying to re-implement enough of Windows from scratch so that it can run all those Windows applications without actually needing Windows.
SCREENSHOTS
Ad
fgprof
DESCRIPTION
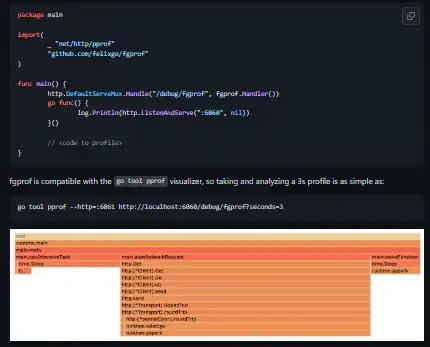
fgprof is a sampling Go profiler that allows you to analyze On-CPU as well as Off-CPU (e.g. I/O) time together. Go's builtin sampling CPU profiler can only show On-CPU time, but it's better than fgprof at that. Go also includes tracing profilers that can analyze I/O, but they can't be combined with the CPU profiler. fgprof is designed for analyzing applications with mixed I/O and CPU workloads. This kind of profiling is also known as wall-clock profiling. If this is the first time you hear about fgprof, you should start by reading about The Problem & How it Works. fgprof is compatible with the go tool pprof visualizer. Which tool you prefer is up to you, but one thing I like about Gregg's tool is that you can filter the plaintext files using grep which can be very useful when analyzing large programs.
Features
- fgprof is compatible with the go tool pprof visualizer
- fgprof is designed for analyzing applications with mixed I/O and CPU workloads
- fgprof is a sampling Go profiler that allows you to analyze On-CPU as well as Off-CPU
- Go's builtin sampling CPU profiler can only show On-CPU time
- fgprof is implemented as a background goroutine that wakes up 99 times per second
- This data is used to maintain an in-memory stack counter which can be converted to the pprof or folded output format
Programming Language
Go
Categories
This is an application that can also be fetched from https://sourceforge.net/projects/fgprof.mirror/. It has been hosted in OnWorks in order to be run online in an easiest way from one of our free Operative Systems.
