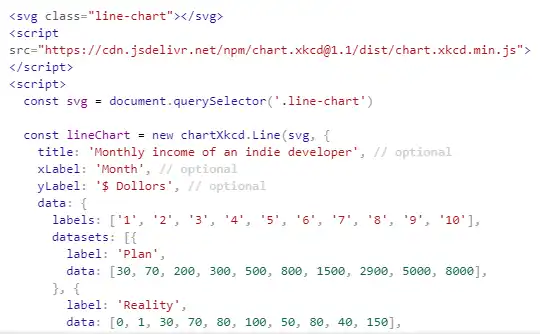
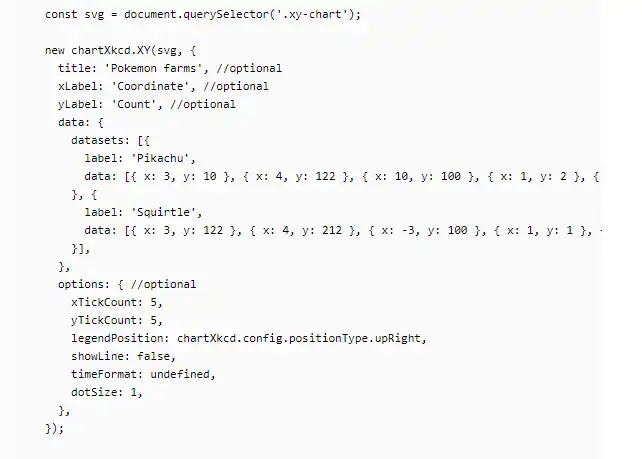
This is the Windows app named Chart.xkcd whose latest release can be downloaded as v1.1.tar.gz. It can be run online in the free hosting provider OnWorks for workstations.
Download and run online this app named Chart.xkcd with OnWorks for free.
Follow these instructions in order to run this app:
- 1. Downloaded this application in your PC.
- 2. Enter in our file manager https://www.onworks.net/myfiles.php?username=XXXXX with the username that you want.
- 3. Upload this application in such filemanager.
- 4. Start any OS OnWorks online emulator from this website, but better Windows online emulator.
- 5. From the OnWorks Windows OS you have just started, goto our file manager https://www.onworks.net/myfiles.php?username=XXXXX with the username that you want.
- 6. Download the application and install it.
- 7. Download Wine from your Linux distributions software repositories. Once installed, you can then double-click the app to run them with Wine. You can also try PlayOnLinux, a fancy interface over Wine that will help you install popular Windows programs and games.
Wine is a way to run Windows software on Linux, but with no Windows required. Wine is an open-source Windows compatibility layer that can run Windows programs directly on any Linux desktop. Essentially, Wine is trying to re-implement enough of Windows from scratch so that it can run all those Windows applications without actually needing Windows.
SCREENSHOTS
Ad
Chart.xkcd
DESCRIPTION
Chart.xkcd is a chart library plots “sketchy”, “cartoony” or “hand-drawn” styled charts. It’s easy to get started with chart.xkcd. All that’s required is the script included in your page along with a single <svg> node to render the chart. You can install chart.xkcd via script tag in HTML or via npm. Line chart displays series of data points in the form of lines. It can be used to show trend data, or comparison of different data sets. XY chart is used to plot points by specifying their XY coordinates. A bar chart provides a way of showing data values represented as vertical bars. A stacked bar chart provides a way of showing data values represented as vertical bars. Display labels near every line (default false). Customize tick numbers you want to see on the main line. You can change size of the dots if you want.
Features
- Customize chart by defining options
- Customize XY chart by defining options
- Customize tick numbers you want to see on the y axis
- Array of colors for different datasets
- Customize font family used in the chart
- Enable or disable xkcd effects
Programming Language
JavaScript
This is an application that can also be fetched from https://sourceforge.net/projects/chart-xkcd.mirror/. It has been hosted in OnWorks in order to be run online in an easiest way from one of our free Operative Systems.


